Dust is the most underestimated substance on Earth. Every year, roughly two billion tonnes of mineral dust are swept into the atmosphere from deserts, dried lakebeds and degraded farmland. It crosses oceans, seeds clouds, fertilises rainforests, carries toxic metals into our lungs — and may have catalysed the first organic molecules in space. Yet for most of us, dust is something to wipe off a shelf.
This is a deep dive into the global science of dust: what it is, where it goes, what it does to our bodies and our climate, and why it matters far more than almost anyone realises.
The planet’s aerial river: atmospheric dust
Most airborne dust originates in a band stretching from West Africa through the Middle East to Central Asia — the so-called “global dust belt.” The Sahara alone is responsible for more than half of all emissions. Other major sources include the Gobi Desert, the Thar Desert, the Arabian Peninsula, and the dry basins of Australia and Patagonia.
A 2025 study in Scientific Reports produced the most up-to-date global dust-source atlas using Sentinel-5P satellite data from 2018 to 2024. The research found that global dust-associated aerosol optical depth has increased between the 2003–2013 and 2013–2024 periods, while dust activity has fallen in irrigated regions such as Mesopotamia. Meanwhile, NASA’s EMIT instrument on the International Space Station is mapping the actual mineralogy of source regions — a critical step, because the iron-oxide content of dust determines whether it cools or warms the climate.
The transatlantic conveyor
NASA’s CALIPSO satellite quantified one of Earth’s most extraordinary transport corridors: approximately 182 million tonnes of Saharan dust are lifted across the Atlantic each year. Of that, 27.7 million tonnes settle over the Amazon basin, carrying roughly 22,000 tonnes of phosphorus — almost exactly replacing what the rainforest loses through rivers and flooding. An additional 43 million tonnes are deposited across the Caribbean.
Key finding: Year-to-year Saharan dust variability is extreme — an 86 per cent difference was measured between the dustiest year (2007) and the cleanest (2011) in the CALIPSO record. The June 2020 “Godzilla” plume was characterised by NASA as the most significant transatlantic dust event in half a century.
Saharan dust also regularly reaches Europe. The Copernicus Atmosphere Monitoring Service tracked multiple intense plumes per spring in 2023–2025. In the Canary Islands during winter 2023–2024, only 12 of 90 winter days were free of “calima” — the local term for Saharan dust haze. A 2025 article in The Lancet Planetary Health flagged sand and dust storms as a growing global health threat, noting that 3.8 billion people were exposed to dust levels above WHO safety thresholds in 2018–2022 — a 31 per cent increase from 2.9 billion in 2003–2007.
Dust and climate change: the largest “maybe” in the energy budget
Dust influences climate through three channels: direct radiation (scattering shortwave light for cooling, absorbing and re-emitting longwave for warming), cloud microphysics (acting as cloud condensation and ice nuclei), and biogeochemistry (fertilising ecosystems that draw down CO₂).
A 2025 analysis in Atmospheric Chemistry and Physics examined the AerChemMIP piClim-2xdust experiment across nine CMIP6 Earth-system models. The results reveal just how uncertain dust’s climate role remains.
The forcing efficiency varies tenfold across models, meaning that uncertainty in dust forcing is likely underestimated in IPCC assessments. Models with more absorbing dust (higher iron-oxide content) and a larger coarse-dust fraction tend to show positive (warming) forcing. When more realistic optical properties are applied, shortwave dust cooling can triple — from −0.24 to −0.78 W/m².
Why this matters: A 2025 global dust-emission dataset warns that because current models fail to capture the observed ~55 per cent rise in dust loading since 1850, they may underestimate the overall negative aerosol radiative forcing. This could in turn affect estimates of climate sensitivity and mislead climate-change predictions reported by the IPCC.
What is in the dust inside your home?
The average person spends roughly 90 per cent of their time indoors, according to the US Environmental Protection Agency. Indoor pollutant concentrations are typically two to five times higher than outdoor levels — regardless of whether homes are in rural or industrial areas.
The DustSafe citizen-science programme, the first standardised international analysis of household dust, has now analysed samples from 35 countries. Three principal contaminant-source factors were identified: a lead–zinc–arsenic factor tied to legacy leaded paint and petrol, a zinc–copper factor from degrading building materials and traffic pollutants, and a manganese factor from natural soil ingress. Lead, arsenic and zinc all increase significantly with home age.
Trace metals in household dust
The DustSafe programme ranked enrichment above crustal background as: zinc > lead > copper > arsenic > chromium > nickel. The highest human-health risk came from chromium, followed by arsenic and lead. In Ghana, New Caledonia and New Zealand, distinct contaminant factors linked to local geogenic and industrial sources were found that did not appear in other countries.
Older homes consistently showed higher levels of lead and arsenic — a legacy of decades of leaded paint and, in some markets, leaded petrol. The programme recommends wet mopping, entry mats, and sealing visible paint in pre-1970 homes as the most effective individual actions.
Endocrine-disrupting chemicals
A 2023 review in Science of the Total Environment found that legacy endocrine disruptors banned years ago — DEHP, BPA, PFOA, PFOS and PBDEs — are still ubiquitous in indoor dust worldwide, though concentrations are declining. Their replacement chemicals (BPS, BPF, organophosphate flame retardants such as TDCPP, and decabromodiphenyl ethane) are now rising in household dust and are themselves suspected endocrine disruptors.
Flame retardants are particularly persistent. The Environmental Working Group found an average of more than 4,600 parts per billion of brominated flame retardants in every US home sampled, with one home reaching above 41,000 ppb.
Microplastics: the new dust pollutant
A landmark international study sampled 108 homes across 29 countries. One hundred per cent of homes contained microplastics. Synthetic polymers dominated in low-income (39 per cent) and high-income (46 per cent) countries; natural fibres dominated in middle-income countries (43 per cent). Lifetime cancer risk from indoor microplastics was estimated at 4.7 per million in low-income countries, 1.9 in high-income, and 1.2 in middle-income — driven by carcinogenic monomers such as vinyl chloride and acrylonitrile.
A 2025 PLOS One study using Raman spectroscopy found median indoor airborne microplastic concentrations of 528 particles per cubic metre in homes and 2,238 per cubic metre inside cars — with 94 per cent of particles under 10 µm, fully respirable. The researchers estimate adults inhale roughly 68,000 to 71,000 microplastic particles per day from indoor air alone.
Why children are most at risk
Hand-to-mouth behaviour, lower body weight per unit of dust ingested, and rapidly developing nervous and endocrine systems combine to make children under two the highest-risk group for indoor dust exposure. The World Health Organization estimated that household air pollution was responsible for 3.2 million deaths per year in 2020, including over 237,000 deaths of children under five.
Polybrominated diphenyl ethers banned since 2006 still persist in furniture foam, carpets and electronic equipment, leaching into dust and accumulating in children’s bodies at rates disproportionate to adults. Frequent wet-mopping and vacuuming with HEPA-filtered units (rather than sweeping, which resuspends particles) remain the single most effective evidence-based interventions.
Occupational dust: a preventable catastrophe
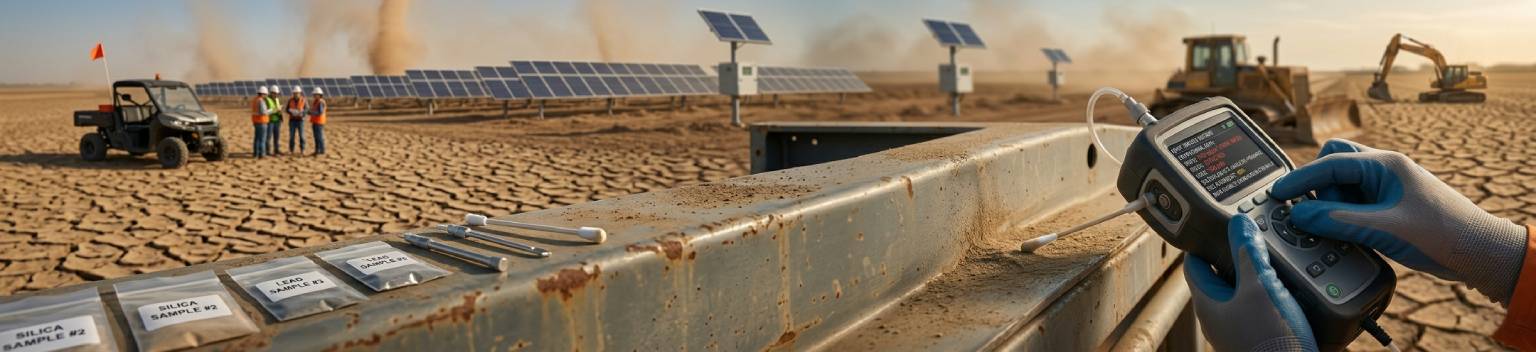
Worldwide, more than 230 million workers are exposed to crystalline silica every year. The material risk varies sharply: marble contains less than 5 per cent silica, granite 10–45 per cent, but engineered (artificial) stone — widely used for kitchen and bathroom countertops — contains up to 97 per cent crystalline silica.
This material differential is driving the worst occupational dust epidemic since asbestos. Engineered-stone silicosis was first described in Spain, Italy and Israel in the early 2010s. Since then, hundreds of cases have been reported in China, Australia, the United States, the United Kingdom and Belgium. In July 2024, Australia became the first country in the world to ban the use, supply and manufacture of engineered stone. Queensland’s screening programme found that 224 of 1,054 workers — 21 per cent — had silicosis, with 3.6 per cent having progressive massive fibrosis.
The Global Burden of Disease 2019 attributed roughly 12,900 deaths and 655,700 disability-adjusted life years to silicosis alone. Total pneumoconiosis (all dust diseases combined) killed 18,323 people in 2021. Silicosis incidence rose 64.6 per cent from 84,426 cases in 1990 to 138,971 in 2019.
Cosmic dust: where life begins?
Estimates of the cosmic-dust input to Earth’s upper atmosphere range from 5 to 300 tonnes per day, depending on the measurement technique. The most widely cited mid-range estimate is around 40,000 tonnes per year, of which only roughly 5,200 tonnes survive to reach the surface — primarily as micrometeorites smaller than 2 millimetres. Approximately 80 per cent has cometary origin.
In late 2025, a paper by Potapov and colleagues in The Astrophysical Journal delivered one of the year’s most striking astrobiology results. In laboratory “dust sandwiches” — thin layers of frozen CO₂ and ammonia layered with porous magnesium-silicate grains — warming from −260 °C to −190 °C produced ammonium carbamate (a prebiotic precursor to urea) only when dust was present. Without dust, the reaction was negligible. The James Webb Space Telescope has separately detected ammonium carbamate in the ices of a protoplanetary disk — suggesting this dust-driven chemistry may be universal.
Volcanic ash: sterile killer, fertile healer
Volcanic eruptions inject ash and sulfate aerosols into the stratosphere, where they can cool the entire planet. The 1991 eruption of Mount Pinatubo in the Philippines caused global temperatures to drop by approximately 0.5 °C for about two years, according to the US Geological Survey.
On longer timescales, volcanic ash fertilises soils. A 2025 paper in Ecosphere showed that basaltic ash at greater than 3 per cent concentration tripled plant biomass production in greenhouse experiments, raised reproductive effort, and — remarkably — increased nitrogen uptake even though nitrogen is not present in the ash itself. The mechanism is not simple nutrient addition but a restructuring of the soil microbiome: plant-growth-promoting bacteria and fungi increase while nematode abundance falls.
Desert dust as ocean fertiliser
Dust deposition onto the ocean supports an estimated 4.5 per cent of global annual export production — the carbon that phytoplankton lock away by sinking into the deep ocean. Iron-limited “high-nutrient low-chlorophyll” regions — the Southern Ocean, the eastern Equatorial Pacific, and the Subarctic North Pacific — are particularly responsive.
A study in Nature Geoscience showed that Saharan dust deposition doubles deep carbon sequestration in the North Atlantic subtropical gyre compared with the equivalent South Atlantic gyre, by boosting nitrogen fixation in diatom communities and providing mineral ballast that helps organic material sink.
Lunar and Martian dust: the final frontier’s dirtiest problem
Lunar regolith is not benign powder. Formed by micrometeorite impacts that pulverise rock and vapourise material that re-condenses on grains as a glassy, razor-sharp shell, it is charged electrostatically by UV radiation and solar wind. Apollo 17 astronaut Harrison Schmitt experienced what he described as “lunar hay fever” — sneezing, watery eyes and throat irritation. The dust wore through three layers of Kevlar-like material on his boot.
On Mars, dust regulates the entire climate system. A November 2025 paper in Nature confirmed — for the first time directly — that Martian dust devils generate electrical sparks. Perseverance’s SuperCam microphone recorded 55 distinct electrical events, 16 during direct dust-devil overpasses. These charges have implications for atmospheric chemistry, surface oxidation, and the safety of future crewed missions.
A timeline of major dust events
The dust-control industry
Estimates of the global dust-control systems market in 2024 cluster around 17–21 billion US dollars, growing at 4–6 per cent annually, with mining (roughly 26 per cent of equipment sales) and construction (roughly 19–21 per cent) leading demand. Asia-Pacific holds 34 per cent of the market, driven by China and India. Wet suppression systems (water-spray and scrubber technologies) account for 62 per cent of market share. The industry is projected to reach approximately 27–28 billion US dollars by the early 2030s.
What can be done
For individuals
The most effective evidence-based action is to vacuum (with HEPA filtration) rather than sweep. Sweeping resuspends particles. Remove shoes at the door, use entry mats, and towel down pets — the DustSafe data identify outdoor soil tracking as a leading source of lead and arsenic indoors. Running kitchen and bathroom exhaust fans and adding HEPA-rated air purifiers in bedrooms addresses the 90 per cent of time spent indoors. Older homes near roadways or industrial areas should consider testing household dust.
For policymakers
Dust should be treated as a first-order climate variable, not background noise. Earth-system models should be required to include anthropogenic land-use forcing on dust emissions, use observationally constrained dust mineralogy following EMIT satellite data, and include super-coarse particles (greater than 10 µm). Indoor-dust guideline values should be established for trace metals, microplastics and endocrine disruptors — currently, only lead has a widely adopted indoor-dust standard.
On emissions reporting and environmental risk, the scale of dust-related health and climate impacts underscores the importance of comprehensive environmental data collection. Organisations working across sustainability reporting frameworks must factor in occupational and environmental dust exposure as a material issue — particularly in mining, construction and manufacturing sectors where crystalline silica and particulate matter represent direct health liabilities.
Domande frequenti
How much dust does the average person inhale per day?
In terms of total particulate matter, an adult inhales approximately 10,000–20,000 litres of air per day. A 2025 study using Raman spectroscopy found that indoor air alone exposes adults to roughly 68,000–71,000 microplastic particles per day, in addition to mineral dust, skin cells, textile fibres and trace metals. The total mass of dust inhaled varies enormously by location and activity level.
Does Saharan dust really fertilise the Amazon rainforest?
Yes. NASA’s CALIPSO satellite measured 27.7 million tonnes of Saharan dust settling over the Amazon basin annually, delivering approximately 22,000 tonnes of phosphorus per year — nearly matching what the rainforest loses through rivers and flooding. However, these figures are based on 2007–2013 data and interannual variability is very high (up to 86 per cent between peak and trough years).
Is dust warming or cooling the planet?
The honest answer is that scientists are not certain. Across nine CMIP6 Earth-system models, the direct radiative forcing of doubled dust emissions ranges from −0.56 W/m² (significant cooling) to +0.05 W/m² (slight warming). The outcome depends heavily on dust composition, particle size and altitude. The most recent assessment (Kok et al. 2023) gives a median value of −0.2 W/m² with a 90 per cent confidence interval of −0.7 to +0.4 W/m².
What is engineered-stone silicosis?
Engineered stone contains up to 97 per cent crystalline silica — far more than natural stones like granite (10–45 per cent). When cut or polished without adequate wet suppression and respiratory protection, workers inhale high concentrations of respirable crystalline silica, causing accelerated silicosis — an incurable fibrotic lung disease. Cases have been diagnosed in workers as young as their 20s with only four to eight years of exposure. Australia banned engineered stone in July 2024.
How much cosmic dust falls on Earth each day?
Estimates range from 5 to 300 tonnes per day depending on the measurement technique. The best mid-range figure is approximately 100 tonnes per day (about 40,000 tonnes per year entering the upper atmosphere), of which roughly 5,200 tonnes per year reach the surface as micrometeorites. About 80 per cent of this material is of cometary origin.
What is the best way to reduce dust in my home?
Vacuum with a HEPA-filtered unit rather than sweeping (sweeping resuspends fine particles). Remove shoes at the door, use entry mats, and wet-mop hard floors. Run kitchen and bathroom exhaust fans to improve ventilation. Consider adding a HEPA-rated air purifier in bedrooms. These actions are the most effective evidence-based measures for reducing indoor dust exposure to trace metals, microplastics and endocrine disruptors.
Are dust storms becoming more frequent?
In many regions, yes. The WMO/WHO indicator found that 3.8 billion people were exposed to dust above WHO safety thresholds in 2018–2022, compared with 2.9 billion in 2003–2007 — a 31 per cent increase. Global atmospheric dust loading has risen approximately 55 per cent since 1850. However, patterns vary: irrigated regions like Mesopotamia have seen declining dust activity, while aridification in the Sahel and Central Asia is increasing emissions. The United Nations has declared 2025–2034 the Decade on Combating Sand and Dust Storms.